
Marketing is not just about campaigns and different strategies. It doesn’t really matter what we are doing if we do not measure its effect from an analytical point of view.
In digital marketing, the conversion points and conversion goals are commonly used ways of measuring back our success. Conversions are milestones that our visitors or leads managed to reach.
But what happens between two conversion points? How can we guess the reasons why one does not reach the next milestone?
One of the most effective tools for tracking the visitors’ or leads’ journey is heat mapping.
Using heatmaps in the past and now

Before we jump into what heatmaps are, let’s go for a quick comparison of how heatmaps were used before and how they can be used today.
The use of heat maps began in the 19th century. The first heatmap was named after Toussaint Loua. He had used different colors to represent social statistics throughout the districts of Paris.
After that heatmaps became popular and widespread. The term, heatmap, as we use it today was founded by Cormac Kinney, a software designer in the 1990’s. He had graphically described information about the financial market in real-time.
Sport heatmaps
Heatmaps are now used in many areas and industries. It can be found in sports, where a player’s performance is measured by this kind of tool. That technology makes decision-making and strategy-building easier for coaches.
Geo-heatmap
Another type of it is geo-heatmap. There are many types of this kind of heatmap for many reasons. They are useful for businesses, especially in tourism. Geographical heatmaps show an interactive visualization that displays your data points on an actual map and signifies low and high-density areas. And nowadays there is an even more interesting and up-to-date use of geo-heatmaps, which is made for following the expansion of coronavirus.
Heatmaps in the business-world
Heatmap is not an unknown word for financial institutions and in the stock market. It enables an easier understanding of plenty of data and makes decision-making easier.
Website heatmap
A website heatmap is the most relevant to the topic of this article. It can track users’ behavior and easily recognize the least and most active parts of your website.
What Do Heatmaps Tell Us?

Heatmaps are highly visualized data presentations that use colors to emphasize the intensity of certain events.
But what do these events mean? Well, it strongly depends on the type of that given heatmap.
There are several types, but we will only cover some of the most frequently used ones. Besides discussing their main features, we will take a look at their use in heating up your e-commerce conversions.
Click Heatmaps
Click heatmaps demonstrate the areas of your website that get the most clicks from the visitors. With the help of these maps, we can measure back whether our content is interesting enough to our audience or not.
We can even analyze the level at which our links and CTAs look clickable. It might happen that the visitors do not follow the expected route because they do not realize their opportunities to click.
Scroll Heatmaps
Scroll heatmaps provide valuable insight in the case of longer web pages or content. Content creators are often eager to know how deeply their readers consume their content.
One way to measure it is to track the scrolls of the webpage. Heatmaps can show us the average amount visitors scroll down thus representing the average interest in that given content.
Mouse Hover Heatmaps
Besides being able to track clicks and scrolls, heat mapping pixels can also identify the routes mice follow.
It is a highly practical function if we are interested in mapping the general order visitors explore our website.
It can help us identify the distracting elements that detour the visitors’ attention.
The list of the types of the different heatmaps could go on more, but these were some of the most important and most commonly used ones.
How Do These Different Types of Heatmaps Help Us to Heat Up Our Conversions?

1. They can identify whether visitors behave the same as we expect
Marketers and web designers often lean on certain theories or practices when deciding on the placement of the different elements on a website. But those expectations might differ from the target audience or industry.
We usually want visitors to focus on certain elements like the CTA button, product picture, or any other feature. From the point of view of the visitors, they either pay attention to it or not.
We can easily demonstrate it in a matrix.
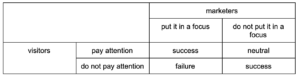
As you can read in the table, our goal is reached when visitors pay attention to the elements we want them to do so and vice versa. What we really want to avoid is visitors ignoring the things we highlight.
By constantly examining our e-commerce website with the help of heatmaps, we can identify the spots that require reconsideration.
2. They can highlight elements that hinder our conversion goals
Heatmaps can successfully indicate the elements that distract the attention from our CTA or other key components.
These elements might be pictures, too-long texts, other CTA buttons that are not strongly connected to our conversion goals, or even the menu bar.
After identifying these interfering parts of a given webpage, we can decide on the necessary changes. These can be anything from decreasing the size or replacing that photo to rethinking the external and internal links of the site.
By considering these changes, you might decrease the ratio of the abandoned carts or turning backs.
3. They can be a base for A/B testing
After identifying the visual elements that require change, we can create new versions of them. But to make sure we use the most effective ones, we should apply A/B testing first.
This method can help us decide whether variants A or B should be applied to a wide audience. Let us see an example. By using heatmaps, we discovered that the CTA button does not gather the expected attention.
We come to a conclusion that the color of the button should be intensified but we do not exactly know how much. Here comes A/B testing, through which we can test two different color variations on a smaller audience.
4. They provide a large dataset about your visitors
Heatmaps serve as field research. By gathering a huge amount of data from several visitors, it provides reliable insights into the visitors’ behavior.
These data are suitable for long-term examinations, comparisons and can help us see inside our prospects’ minds.
You can discover hidden trends and behavioral elements that can help to engage with the visitors in a more effective way in the future. Heatmaps provide information at a relatively low cost as it is completely automated.
Wrapping up
All in all, heatmaps are one of the most useful automated methods to track the effectiveness of our e-commerce website.
With its several types, every marketer and web designer can find the perfect way to measure the key elements that contribute to successful conversions.
- We can compare the visitors’ behavior to our expectations.
- We can identify the elements that distract visitors thus hindering our conversion goals.
- We can use the insights gathered from heatmaps for A/B testing.
- We can get a deeper understanding of our visitors and prospects by analyzing the collected data.
What more can we expect from a pixel-based analytical method? Give a shot at this amazing tool!

I’m a London-born lover of technology, obsessed with online business, passive income and the digital economy. I love learning, researching and curating the most valuable resources to save you time, money and help you discover the truth on what it actually takes to achieve your goals.